The Optimise Rota tab enables you to align your staff levels to your forecast sales throughout the day.
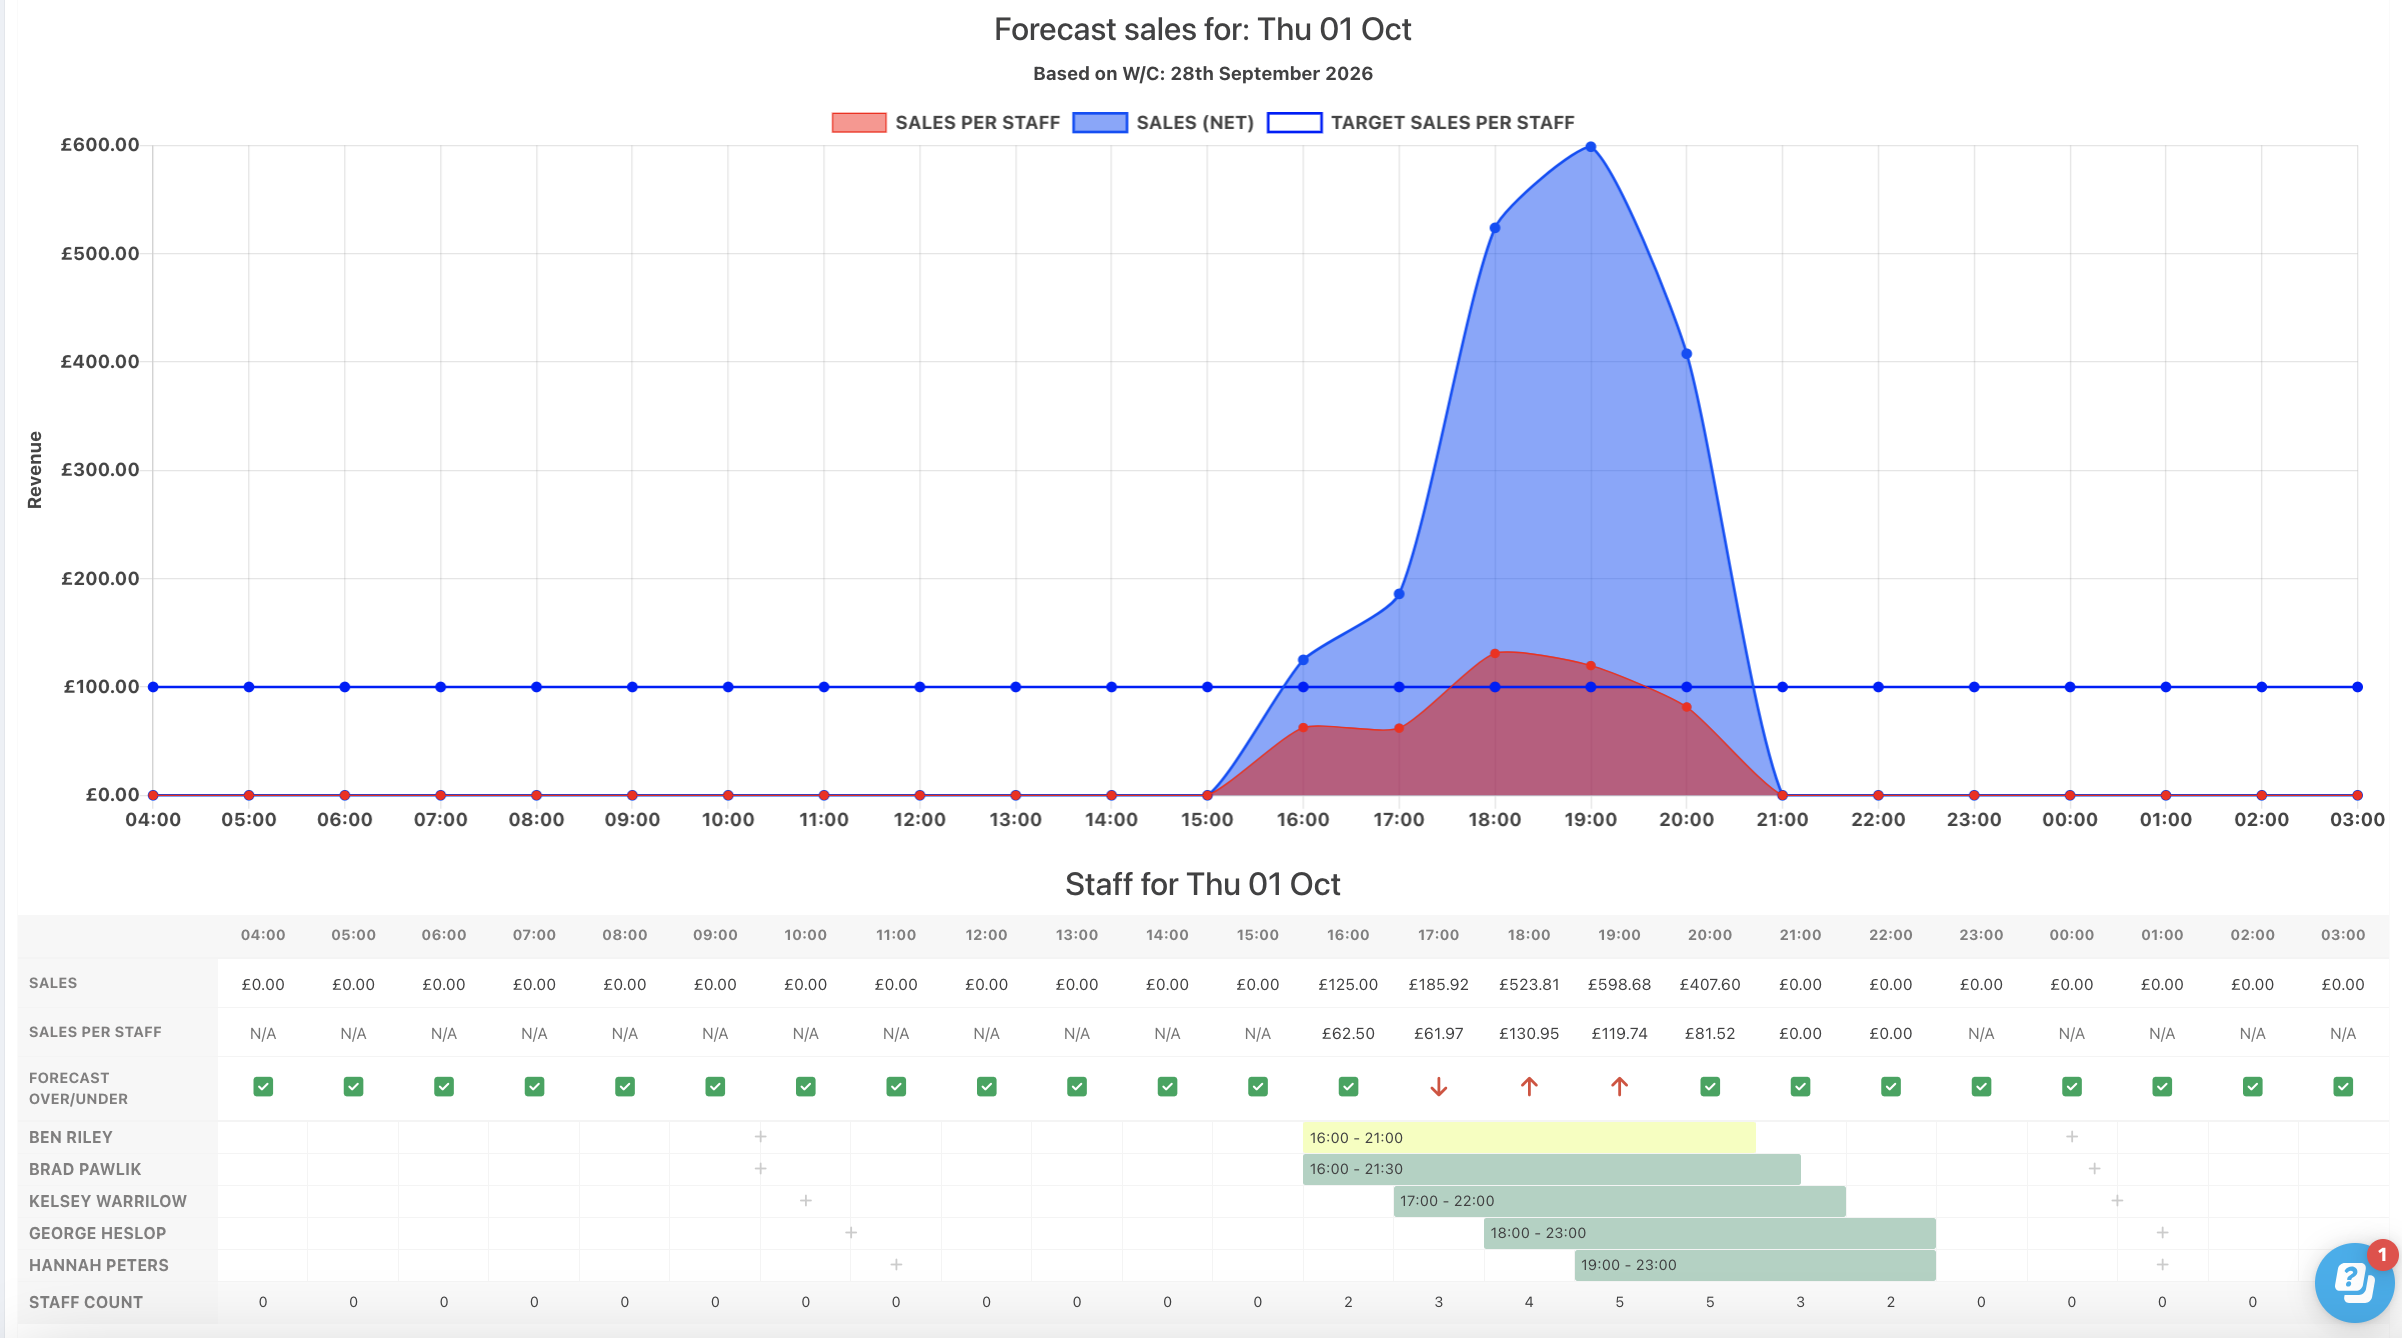
You can see how your staff levels line up with the daily trends from the week you used to forecast your sales. Then you will see indicators of where you might be over- or under-staffed, based on your forecast sales for each hour and the number of staff you have on shift.
At the bottom of each day, you can see which staff are on each hour and make any necessary edits, in line with your daily sales trend and target sales per staff member.
If you need to align different staff areas to different types of sales, such as bar staff to drinks sales, and kitchen staff to food sales, you can set these up as departments. Once you set up departments, they will appear separately on the Optimise rota tab, so you can ensure each area is optimised to the correct sales profile.
Setting target sales and minimum staff
Before optimising your rota, set a target sales per staff member and minimum staff level.
If you use departments, you can configure these for each department when you create it.
If you don't use departments, you can set these for the venue on the Staff Scheduling tab of the Setup module.
Target sales per staff member - If you already have rotas in your system, you can estimate this by looking at the Optimise rota tab on historic rotas and seeing what sales per staff member was during a busy period when you feel you were optimally staffed.
You can also see your daily average sales per staff hour on the Staff costs tab of the Management Reports.
Minimum staff level - This is the minimum number of staff you need to operate your venue, or the specific department, regardless of the level of sales
You can change these settings at any time, so you can tweak your target sales per staff member as you learn what the optimal level should be.
Optimising your rota
To optimise your rota, click on the Optimise rota tab. If you need to change the week used for the sales data, you can do this on the forecasts tab.
Sales (net) - The blue graph shows your sales for the specified day by the hour.
Sales per staff - The red line shows the sales divided by the number of staff on shift during that hour.
Target sales per staff - The blue line shows the target you currently have set for sales per staff member
The table below the graph shows you:
- Staff count - how many members of staff are on shift during that hour
- Sales per staff - the sales per staff figure for that hour
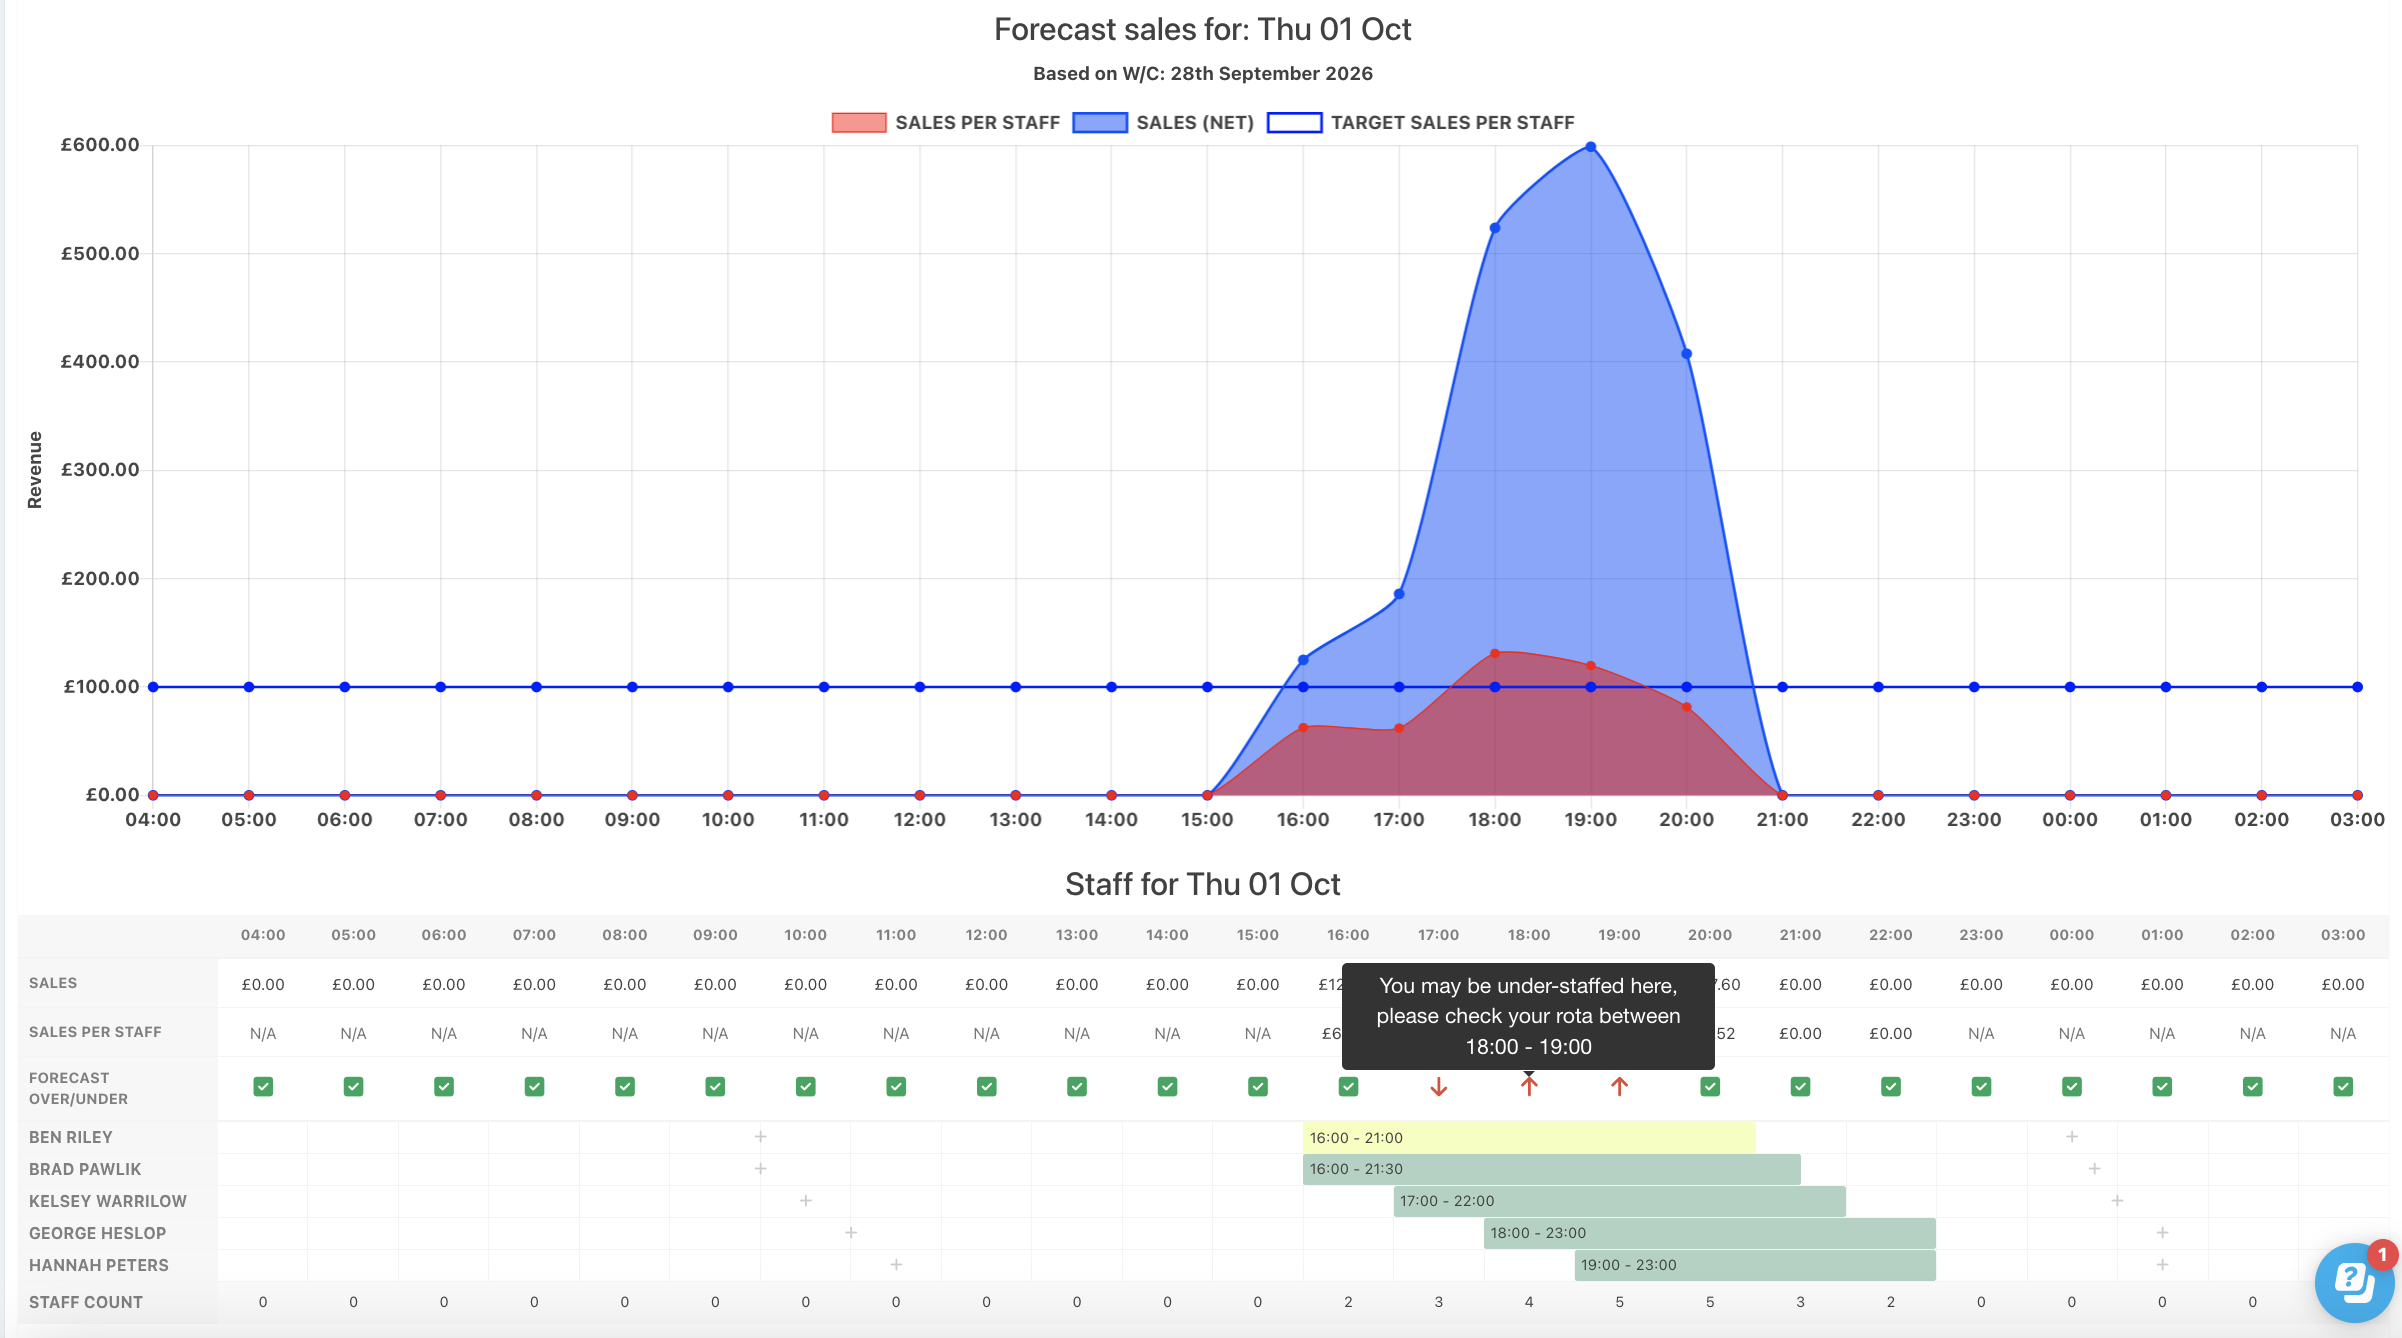
- Forecast over/under - an indication of where you may be over- or under-staffed.
- If you would still be under your target sales per staff member with fewer staff, the system will indicate that you may be over-staffed
- If you are over your target sales per staff member, the system will indicate that you may be under-staffed
Was this article helpful?
That’s Great!
Thank you for your feedback
Sorry! We couldn't be helpful
Thank you for your feedback
Feedback sent
We appreciate your effort and will try to fix the article